The Solar Electricity market is quite interesting. You could nearly compare it to mobile phone annual tariffs or even energy tariffs, designed to be undecipherable. For a market that is growing very strongly, it isn’t easy to get access to performance data. Is there a reason why this is the case?
Electricity is one of those real tangible things; it’s unambiguously about kilowatt-hours, a genuine number that is easily transferable into cash value. You’ll notice, everybody has the “best” product, but are they able to demonstrate it, and prove that they have the best product? Can they supply data which shows this? Why is there so little data available online if it’s so good?
Let’s look at some real live data and see what we can ascertain why this may be the case, and give you the information you need to make sure you are making good purchasing decisions.
We are going to look at 2 x locations and 3 x different Renewable Electricity Technologies (Solar PV as an acronym you might be familiar with). In this rare case, there is access to public data on all systems, albeit not full data but enough for us to make monthly comparisons.
Firstly, we are going to look at North East Galway and a HONE renewable electricity system installed in November 2018. We are going to look at a second installation, but we are not going to name the product as it is not in the public domain, but it is a well known Solar PV brand being widely installed in Ireland. The HONE system is a 2KW(p) residential system, and the “other” system is a 5.13KW(p) public school system installed in August 2019. Because they are different sizes, we will equalise the data back to 1 KW(p), so a direct comparison can be made on the performance of both systems.
(NOTE: Ireland is a reference country for testing HONE thermal & electric technologies due to the lack of sunlight in the country, HONE is a daylight NOT sunlight technology.)
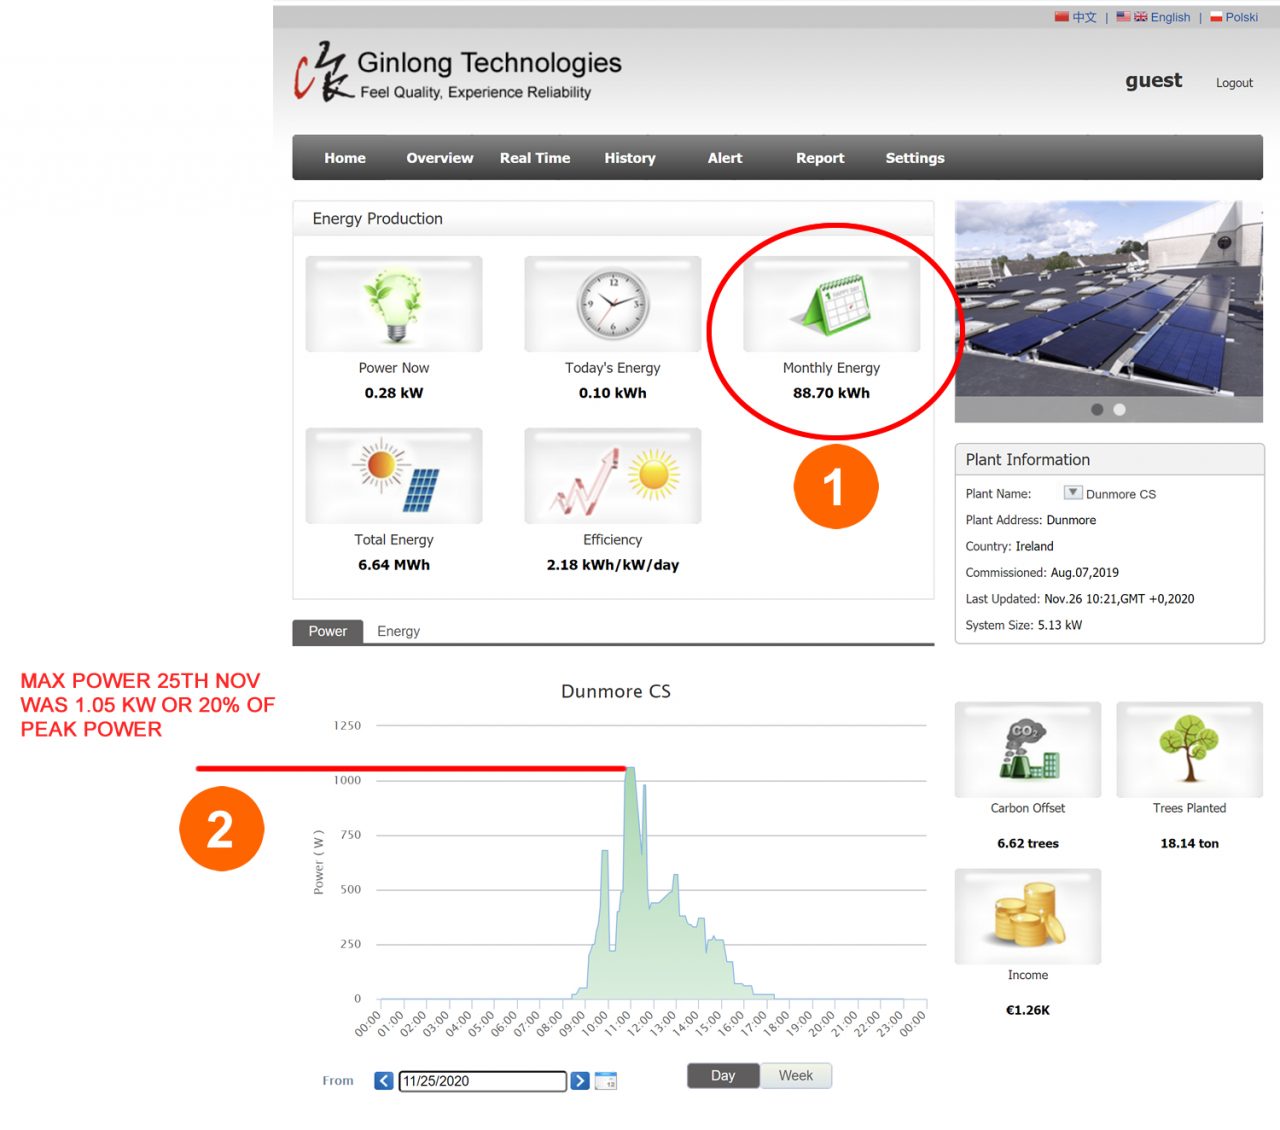
The first system is a school system which was purchased by Tender, and you could conclude that as it was tender based, it could have been solely driven by the price (which is the incorrect way to buy renewables). You will never own premium renewable technologies if that’s your approach. Performance comes at a cost so to make a valid purchase decision, and you need both cost and performance data of any technology.
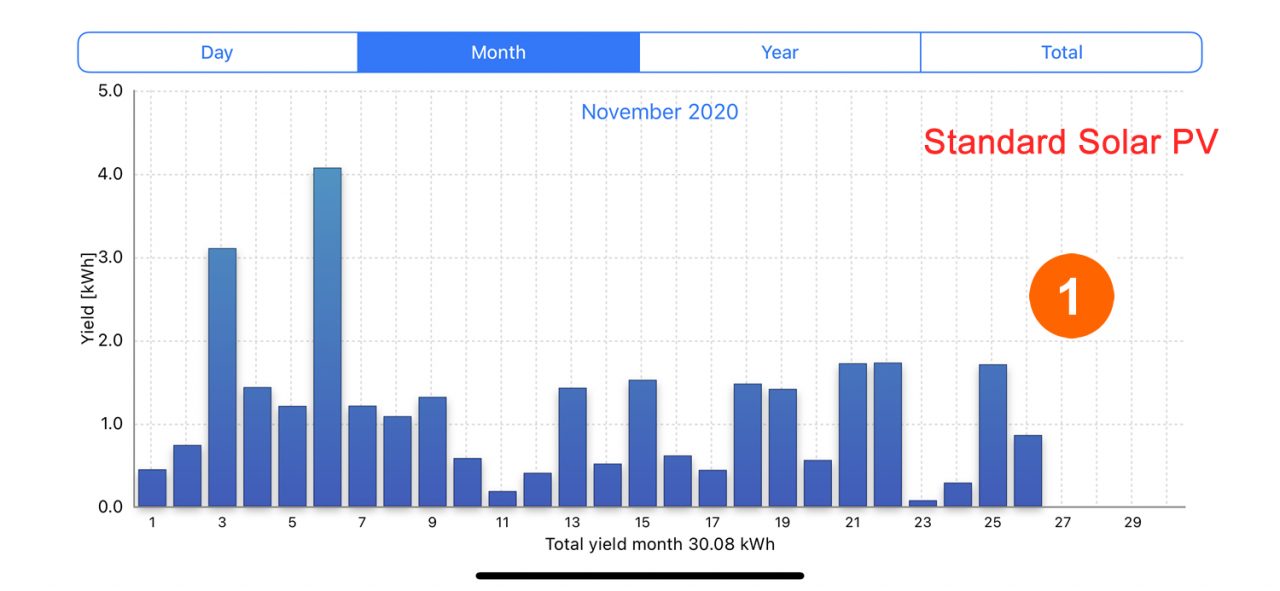
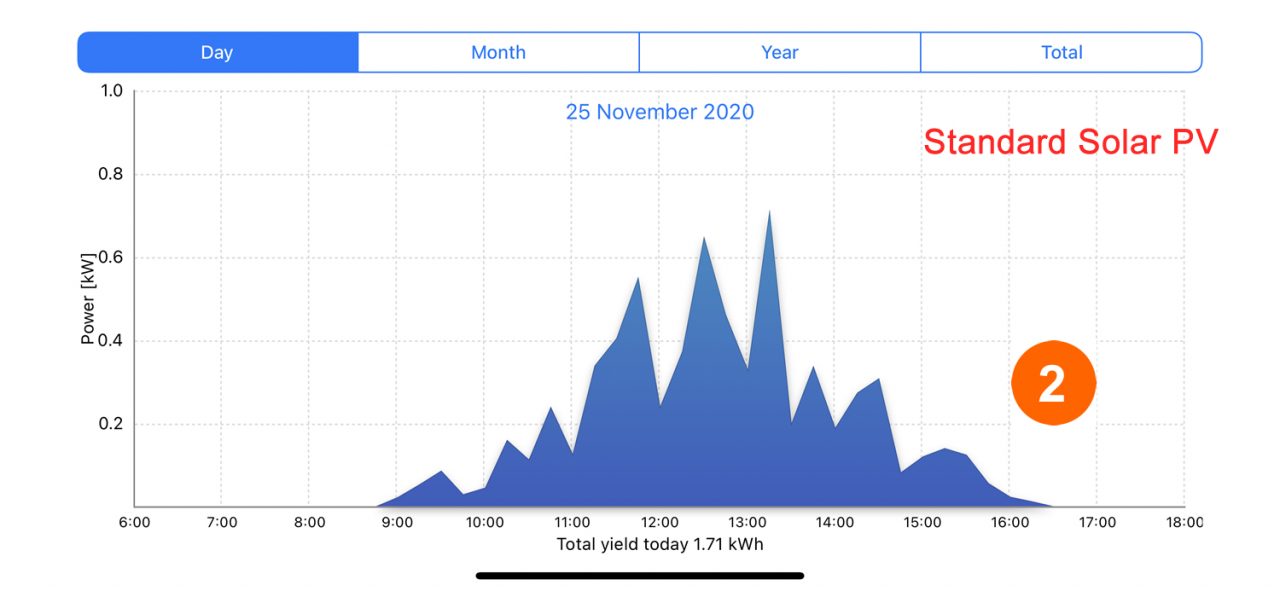
On the screenshot below, you can see 2 key performance figures, the red circle (No 1.) is showing how much free electricity in kWhrs has been generated so far in November, and the red line (No 2.) is showing what the peak output inKW Power was during the day (25th Nov 2020). This data is summarised in the table below both screenshots.
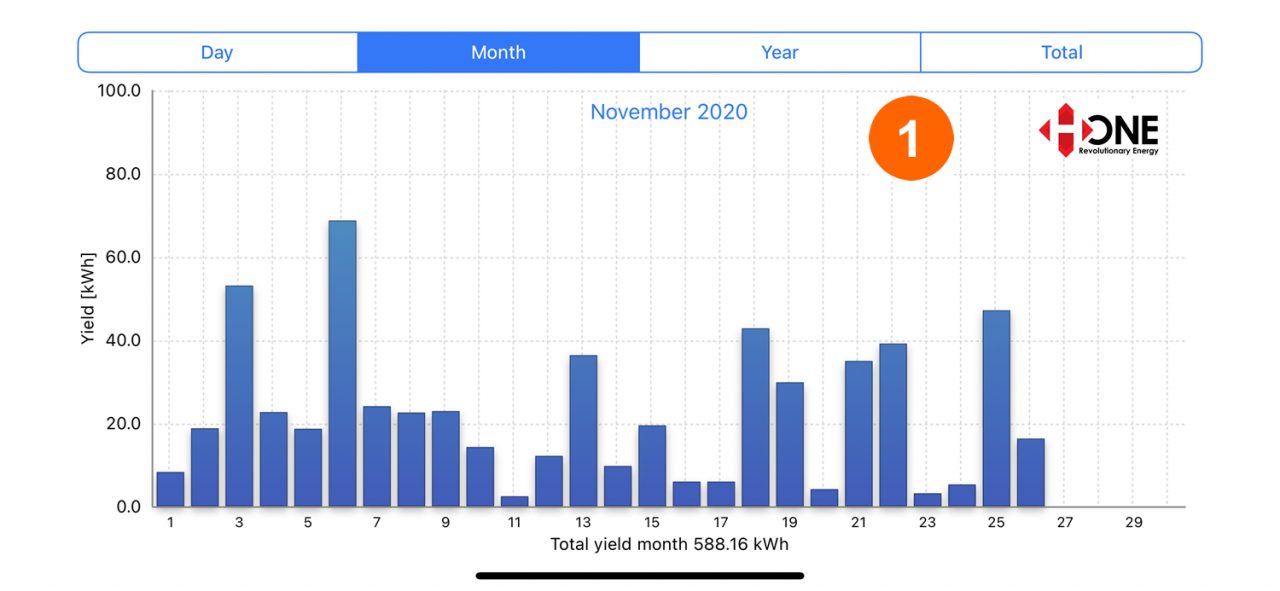
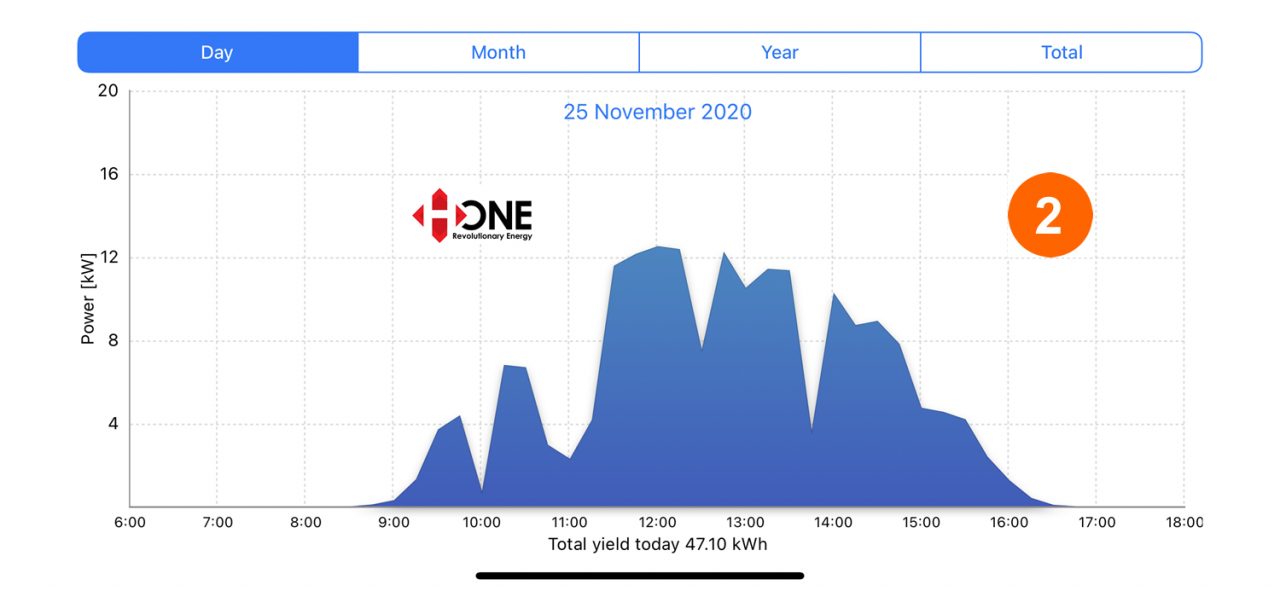
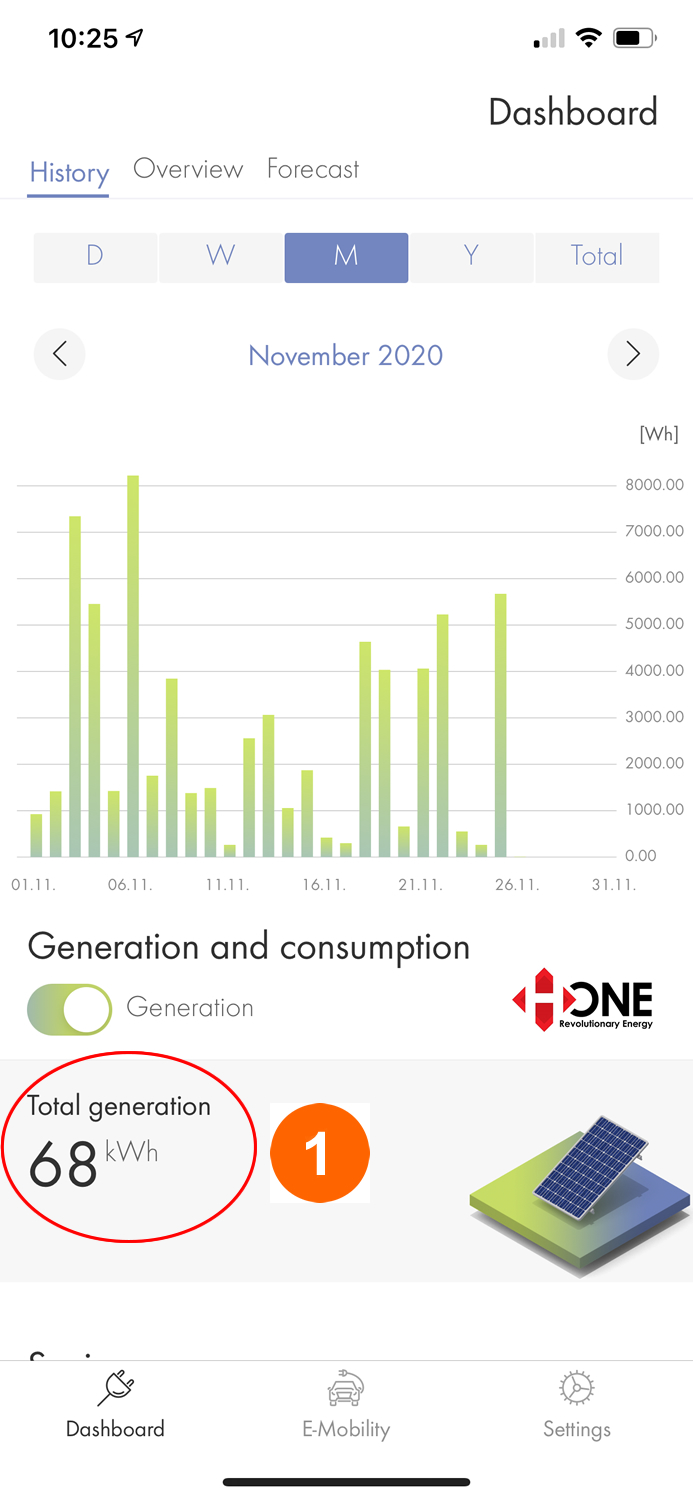
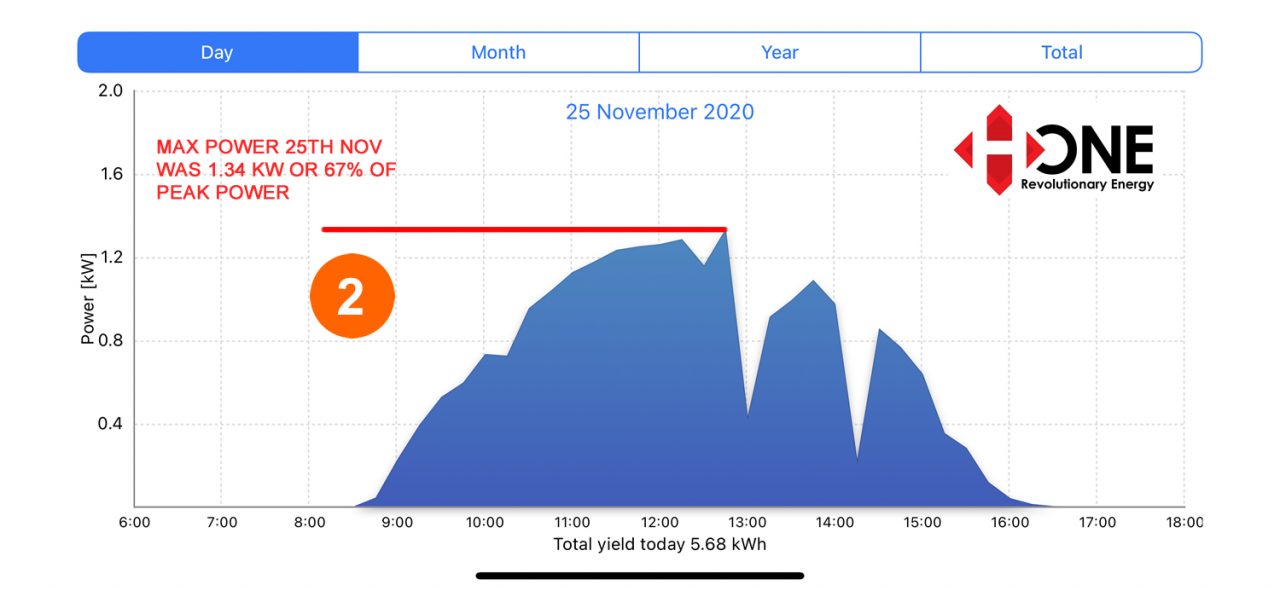
On the 2nd & 3rd screenshot below, you can see the monthly performance of the HONE system in the same area. (No 1) is the monthly performance to date and (No 2) is the peak power achieved on the day (25th Nov 2020)
So now we have all the data we need to compare both systems and their performance. This data is summarised in the table below.
TABLE
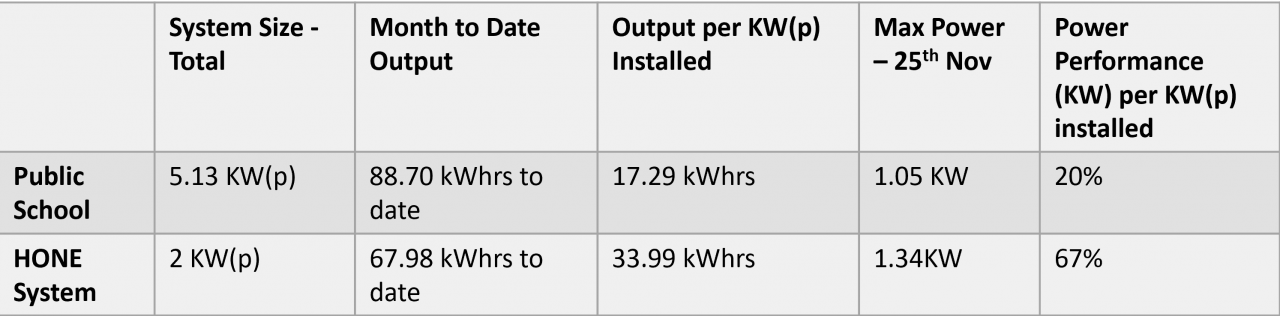
From the table, we can see the following information.
1/ The output performance for November to date between the 2KW HONE Electric system and the 5.13KW “Other” leading brand system is only 30% ahead despite being 256%larger system. NOTE: this type of performance difference cannot be explained away by inverter or cable choice. (Both systems are in the same location and face the same direction.)
2/The HONE system was able to achieve 67% of its rated KW output versus only 20% in the other market-leading system. (That is a staggering difference again not explained away by inverter choice or cable excuses)
3/ The smaller HONE 2KW system was able to hit a power high of 1.34 KW during the day versus the power high of the other market-leading brand being 1.05 KW, yet the system was rated at 5.13KW(p) versus the HONE systems size of 2 KW(p).
4/ Pound for pound as the saying goes or “KW(peak)” installed in this business, the HONE system located in the same area is producing 96.5% more output kWhrs in November than the other market-leading system.
HONE performance IS 96.5% HIGHER per KW(p) installed, now that’s performance and it’s based on data not brochures.
NOW let’s LOOK AT ANOTHER COMPARISON FROM THE SAME DAY IN COUNTY MAYO AND 2 MORE SYSTEMS, a Market Leading German system and a HONE PRIVATE GRID system.
The first system is a residential system of 2.15 KW(p), and the HONE system is an off-grid (private grid) 21 KW(p) load-following system. This means it only generates power when there is a load, unlike a grid-connected system which generates power “all the time it can” which spills into the grid if not being used. The performance on a private grid system is lower than grid-connected as it only runs when there is a load.
On the screenshot below, you can see 2 key performance figures, the red circle (No 1.) is showing how much free electricity in kWhrs has been generated so far in November, and the red line (No 2.) is showing what the peak output inKW Power was during the day (25th Nov 2020). This data is summarised in the table below both screenshots.